Componentes do Sistema - Software X3 PRO
PRODUCT DESCRIPTION
X3 PRO Software is an essential part of the X3 PRO product series. Developed with the power user in mind, the X3 PRO Software features a faster, more powerful engine with enhanced analytical tools. The software package offers 2D, 3D, and graphing view options. The data is viewed dynamically and recorded as a XSENSOR file format.
Recorded data can be exported for further analysis or imported into other applications such as Matlab.
The X3 PRO software has many analytical tools for general research purposes as well as specific functions and tools for automotive and tire designers. Easily stream video along pressure images, creates sensor groupings, make measurements, and compare multiple files.
PRO V6.0 – NEW FEATURE HIGHLIGHTS
Engine Performance Improvements
• Collected data is saved immediately to the disk reducing the risk of data loss
• Over 100% faster frame rate for 4 sensor pack system with 65,536 sensing points
• Load or save up to 500GB files in under 1 second
• Allows for sessions with up to 100 million frames or 500GB of data
File Comparison Tools
• Simultaneous playback of up to 4 files
• Multiple frame and file comparisons
• Windshield wiper sensor users can graph multiple files for product and data comparisons
Measurement Tools
• Line measurement allows users to measure pressure image dimensions
• Area measurement allows users to calculate areas within a pressure image
Imaging Tools
• Thumbnail preview strip displays each frame in filmstrip format
• Thumbnail view includes preview of attached videos, photos, and notes
• Improved overall frame navigation
• Improved 2D zoom functionality
Export/Analysis Tools
• Copy, paste and select pressure values from 2D image directly into spreadsheet
• Export a sensor group in its original shape directly into a spreadsheet
• Copy and paste cross-section values into spreadsheets (cross-hair or average)
• Export files into html viewable format
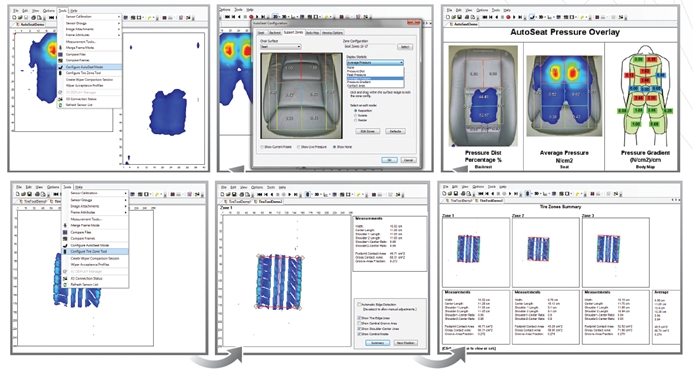
Each XSENSOR view mode has multiple settings and options to control sensor data viewing:
2D Top view of the sensor shows pressure levels in different colours defined by the pressure isobar legend; view can be rotated or flipped to match positioning.
3D Perspective view of the sensor shows pressure levels in different colours and height contours; rotate view in any direction to maximize visual clarity.
Frame Compare - Show up to 4 snapshots side-by-side for easy comparison.
Pressure vs. Time Graph - pressure readings over time; pressure reading can be either peak or average for the sensor.
Numeric Mode - 2D mode shows numerical pressure readings in each sensing cell and dynamic full-colour display.
ANALYSIS AND STATISTICS
X3 PRO v6.0’s features help support the dynamic analysis of pressure readings within a user-defined group or the entire sensor pad:
Peak Pressure Monitor the highest pressure on one or more cells of a given pressure imaging data frame.
Average Pressure Calculate an average pressure over the entire sensor surface.
Contact Area Calculate area of the sensor loaded by a subject.
Sensor Cell-Group Analysis
Define groups of sensing cells for separate analysis from the rest of the pressure image; same statistical analysis tools for entire system can also be applied to sensor cell groups, define group templates to facilitate sensor cell-group analysis, and measure the statistical variance of the sensor output in your defined sensor groups.
File Compare Examine up to four pressure imaging sessions simultaneously to compare and analyze data.
X3 PRO Software is an essential part of the X3 PRO product series. Developed with the power user in mind, the X3 PRO Software features a faster, more powerful engine with enhanced analytical tools. The software package offers 2D, 3D, and graphing view options. The data is viewed dynamically and recorded as a XSENSOR file format.
Recorded data can be exported for further analysis or imported into other applications such as Matlab.
The X3 PRO software has many analytical tools for general research purposes as well as specific functions and tools for automotive and tire designers. Easily stream video along pressure images, creates sensor groupings, make measurements, and compare multiple files.
PRO V6.0 – NEW FEATURE HIGHLIGHTS
Engine Performance Improvements
• Collected data is saved immediately to the disk reducing the risk of data loss
• Over 100% faster frame rate for 4 sensor pack system with 65,536 sensing points
• Load or save up to 500GB files in under 1 second
• Allows for sessions with up to 100 million frames or 500GB of data
File Comparison Tools
• Simultaneous playback of up to 4 files
• Multiple frame and file comparisons
• Windshield wiper sensor users can graph multiple files for product and data comparisons
Measurement Tools
• Line measurement allows users to measure pressure image dimensions
• Area measurement allows users to calculate areas within a pressure image
Imaging Tools
• Thumbnail preview strip displays each frame in filmstrip format
• Thumbnail view includes preview of attached videos, photos, and notes
• Improved overall frame navigation
• Improved 2D zoom functionality
Export/Analysis Tools
• Copy, paste and select pressure values from 2D image directly into spreadsheet
• Export a sensor group in its original shape directly into a spreadsheet
• Copy and paste cross-section values into spreadsheets (cross-hair or average)
• Export files into html viewable format
Each XSENSOR view mode has multiple settings and options to control sensor data viewing:
2D Top view of the sensor shows pressure levels in different colours defined by the pressure isobar legend; view can be rotated or flipped to match positioning.
3D Perspective view of the sensor shows pressure levels in different colours and height contours; rotate view in any direction to maximize visual clarity.
Frame Compare - Show up to 4 snapshots side-by-side for easy comparison.
Pressure vs. Time Graph - pressure readings over time; pressure reading can be either peak or average for the sensor.
Numeric Mode - 2D mode shows numerical pressure readings in each sensing cell and dynamic full-colour display.
ANALYSIS AND STATISTICS
X3 PRO v6.0’s features help support the dynamic analysis of pressure readings within a user-defined group or the entire sensor pad:
Peak Pressure Monitor the highest pressure on one or more cells of a given pressure imaging data frame.
Average Pressure Calculate an average pressure over the entire sensor surface.
Contact Area Calculate area of the sensor loaded by a subject.
Sensor Cell-Group Analysis
Define groups of sensing cells for separate analysis from the rest of the pressure image; same statistical analysis tools for entire system can also be applied to sensor cell groups, define group templates to facilitate sensor cell-group analysis, and measure the statistical variance of the sensor output in your defined sensor groups.
File Compare Examine up to four pressure imaging sessions simultaneously to compare and analyze data.
![]() Componentes do Sistema - Software X3 PRO - Catálogo em formato PDF
Componentes do Sistema - Software X3 PRO - Catálogo em formato PDF